#datenjournalismus

The Complete List of Trump’s Twitter Insults (2015-2021)

As a political figure, Donald J. Trump used Twitter to praise, to cajole, to entertain, to lobby, to establish his version of events — and, perhaps most notably, to amplify his scorn. This list documents the verbal attacks Mr. Trump posted on Twitter, from when he declared his candidacy in June 2015 to Jan. 8, when Twitter permanently barred him.

(via John Gruber, who comments this perfectly: „How great, too, that it can be said to be complete.“)
What Parler saw during the Attack on the Capitol

As supporters of President Donald Trump took part in a violent riot at the Capitol, users of the social media service Parler posted videos of themselves and others joining the fray. […] Below is a collection of more than 500 videos that ProPublica determined were taken during the events of Jan. 6 and were relevant and newsworthy. Taken together, they provide one of the most comprehensive records of a dark event in American history through the eyes of those who took part.

ProPublica hat die Videos, die von den aufständischen Trump-Anhängern beim Strum auf das Kapitol selbst auf die rechte, mittlerweile nicht mehr verfügbare Social-Media-Plattform Parler gestellt wurden, gesichtet und in eine irre, interaktive Timeline des Wahnsinns gepackt. (via Waxy)

Nicht nur aus aktuellem Anlass mal wieder ein paar Corona-Links:

  1. Wehmütig erinnere ich mich an die Zeit als sowas noch eigenständige Blogposts waren… []

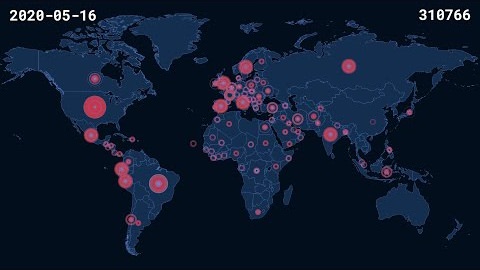
A Time-Lapse Map of Every Death From the Coronavirus Pandemic

 
(YouTube Direktlink)

This is an audio-visual time-lapse of every death from the Coronavirus pandemic from January to June 2020. […] Each country is represented by a tone and an expanding blip on the map when a death from Covid-19 is recorded. Each day is 4 seconds long, and at the top of the screen is the date and a counter showing the total numbers of deaths.

Eine sehr eindringliche, bedrückende Arbeit vom Komponisten James Beckwith, die in 13 Minuten alle Coronavirus-bedingten Tode von Anfang Januar bis Ende Juni visualisiert und auditiv erlebbar macht. Und von der es wohl leider eine Fortsetzung geben wird:

The virus grows continuing to work its way throughout the world until the end of June – where this piece ends but the real virus has not. At the time of writing this Covid-19 has claimed over 500,000 deaths worldwide. It is likely a sequel will need to be made.

(via Kottke)